 International
 Singapore
 Malaysia
 Thailand
 Vietnam
Your shopping cart is empty!

IRIV PiControl - Control and Monitor Using Blynk With Node-RED
- Abdulrahman Alhamed
- 28 Mar 2024
- Tutorial
- Advanced
- 399
Hi and welcome back to another tutorial on using IRIV PiControl and Node-RED. In this tutorial, we will learn how to work with Blynk platform to control and monitor data on IRIV.
What is Blynk?
Blynk is a platform that allows you to easily build IoT (Internet of Things) projects by providing a drag-and-drop interface to control hardware devices and collect data from sensors. It offers a mobile app for remote monitoring and control of your IoT projects, making it accessible for both beginners and experienced developers.
Get Familiar With Blynk
We will start by setting up a new template for IRIV in Blynk.
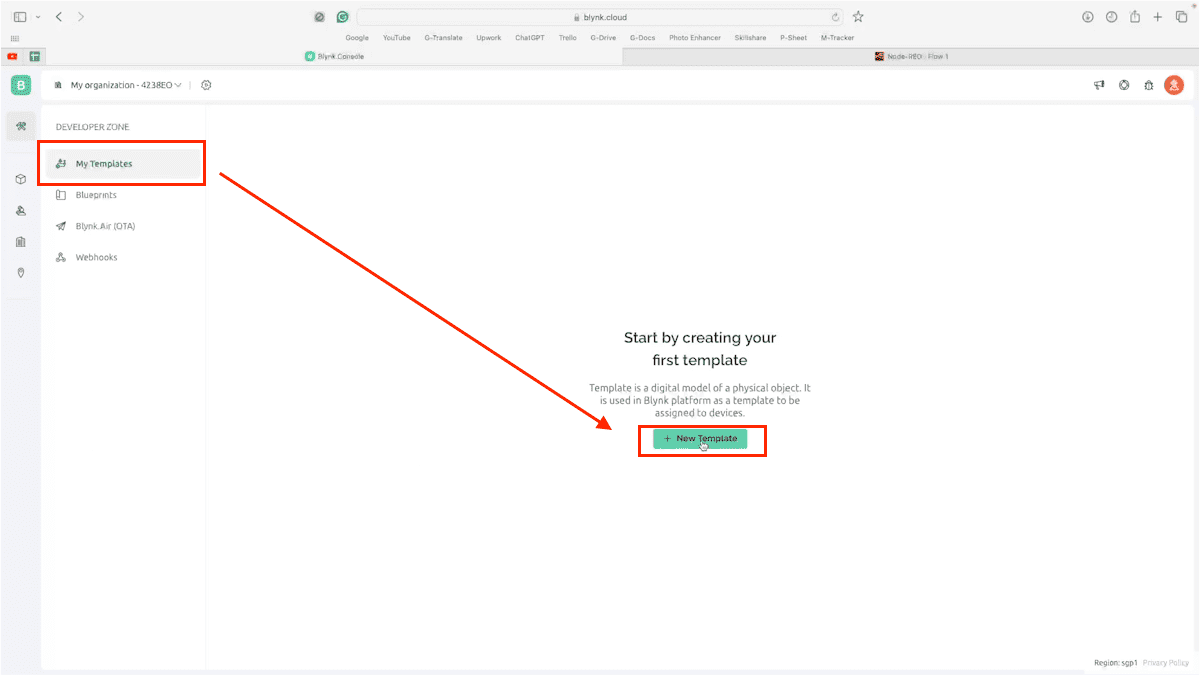
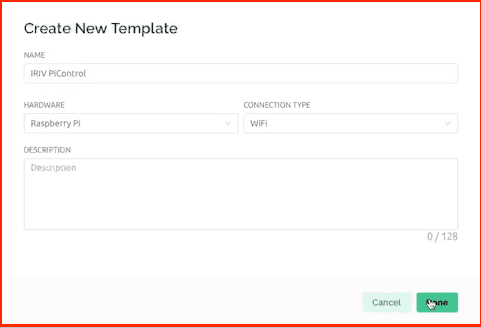
Rename the template, then choose Raspberry Pi as the hardware. Then save it.
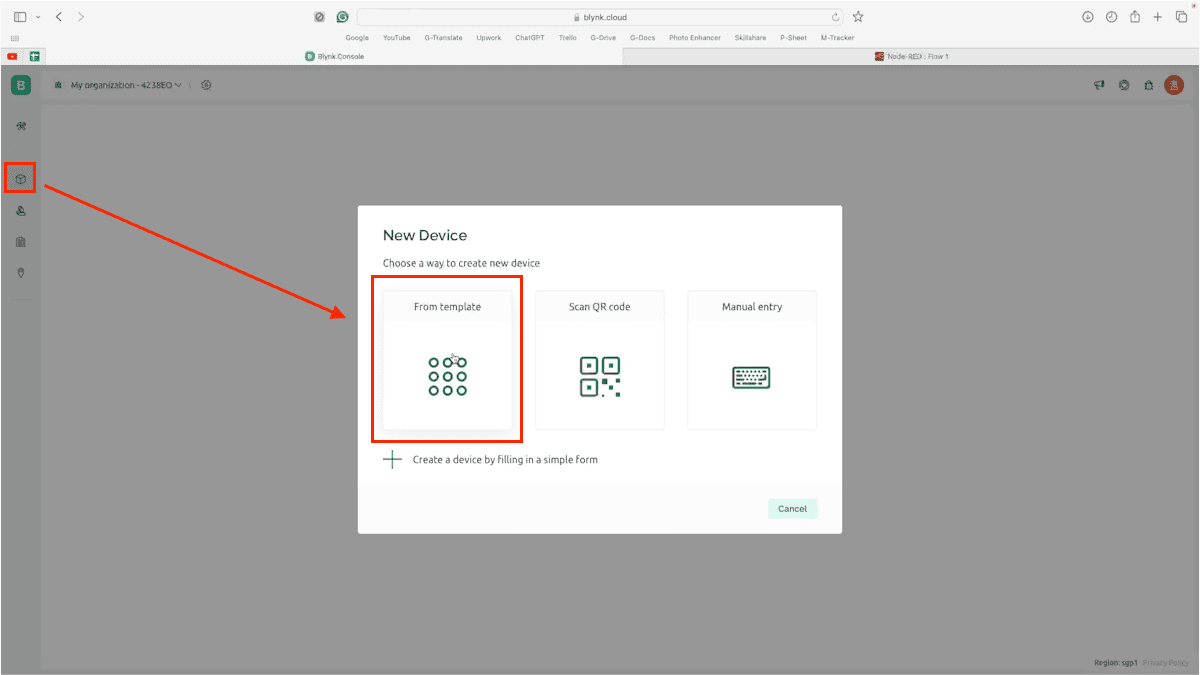
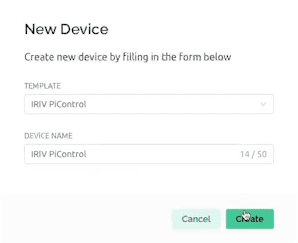
Now, go to Devices window, and add a new device from the template that you have created.
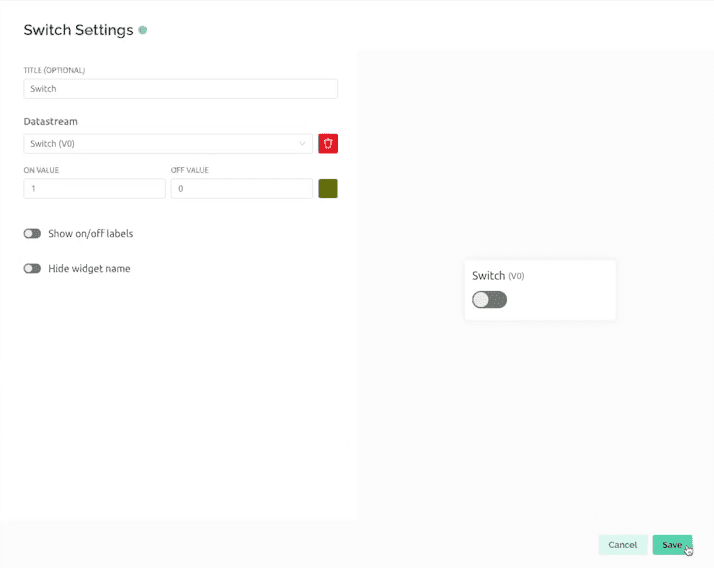
Next, we will customise our dashboard, firstly, we will add a Switch so we can control the GPO in IRIV.
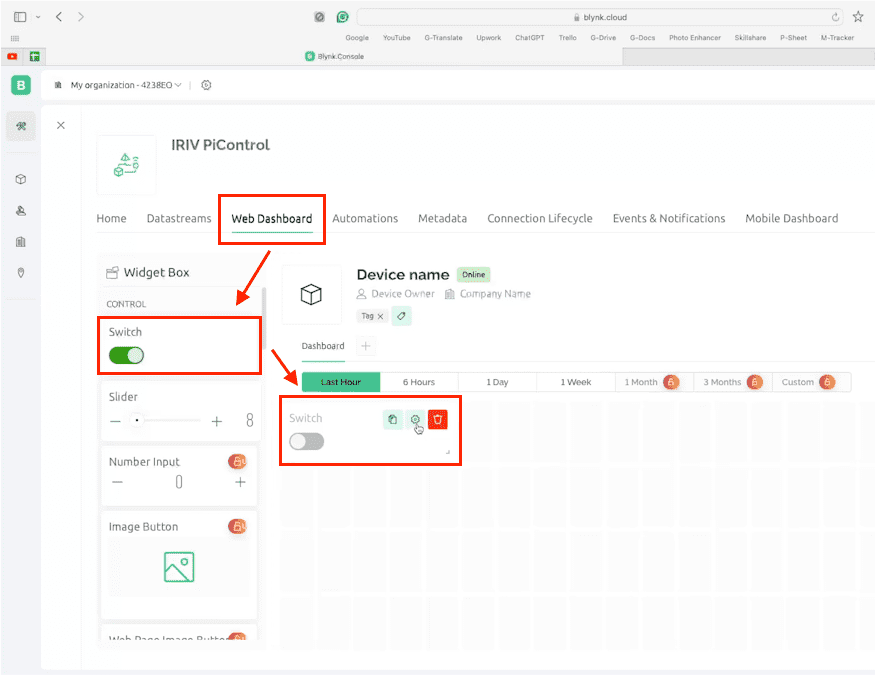
open its settings, add a new virtual pin. Assign the virtual pin for the switch as V0. Then save your changes.
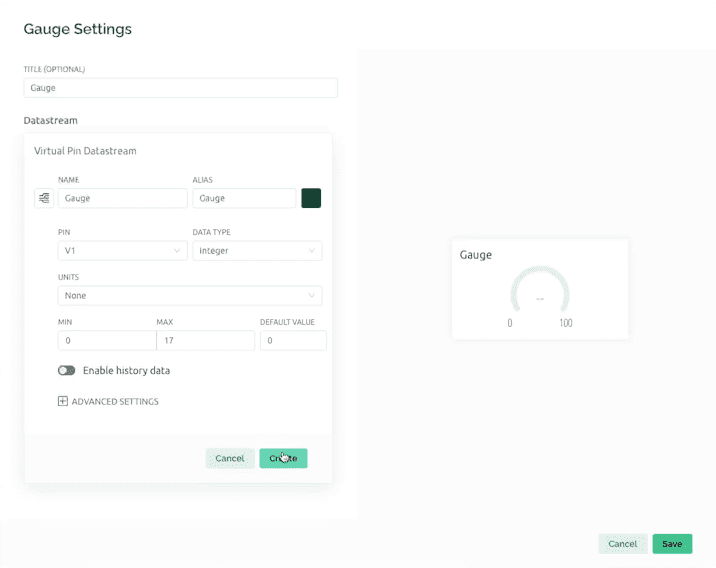
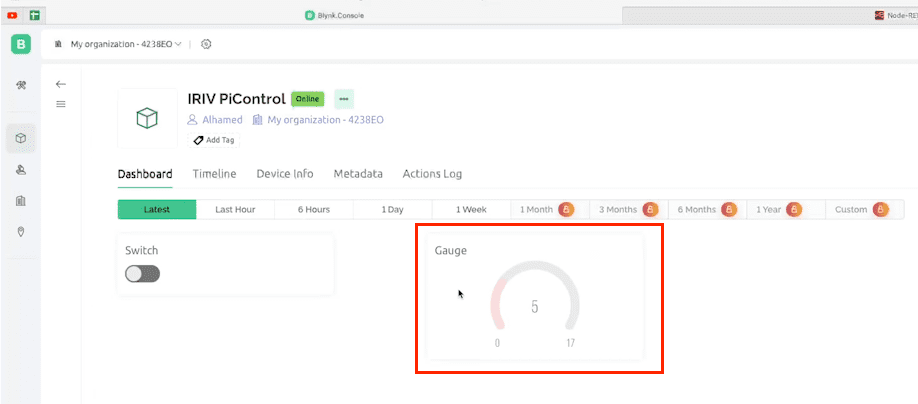
After that we will add a Gauge chart, so we can display data on it. Open its settings, and add a new virtual pin, let it be (V1), and feel free to modify the other settings, and make sure to save your changes at the end.
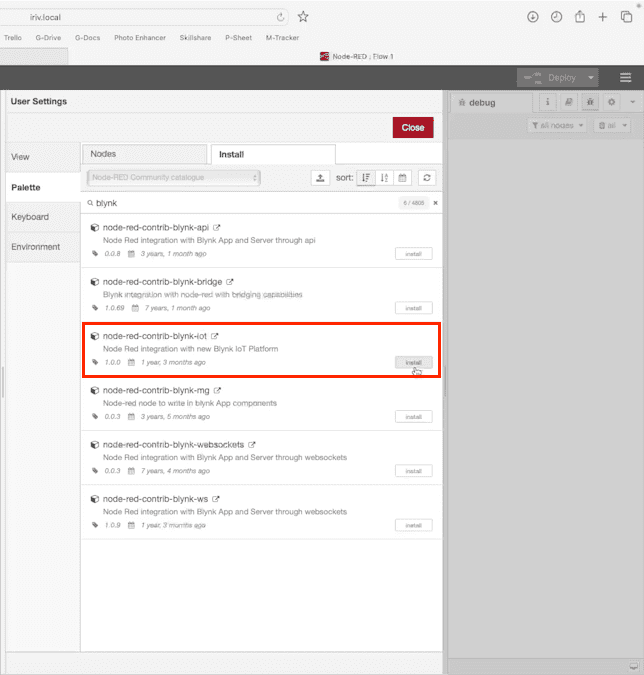
Now, moving back to Node-RED, firstly, we will need to install Blynk nodes from the palette manager.
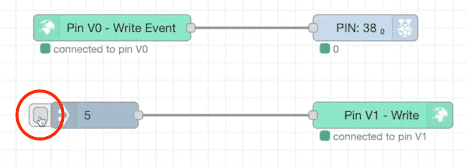
Next, we will use “Write Event’ node to control the GPO. Open its properties, and configure these settings.
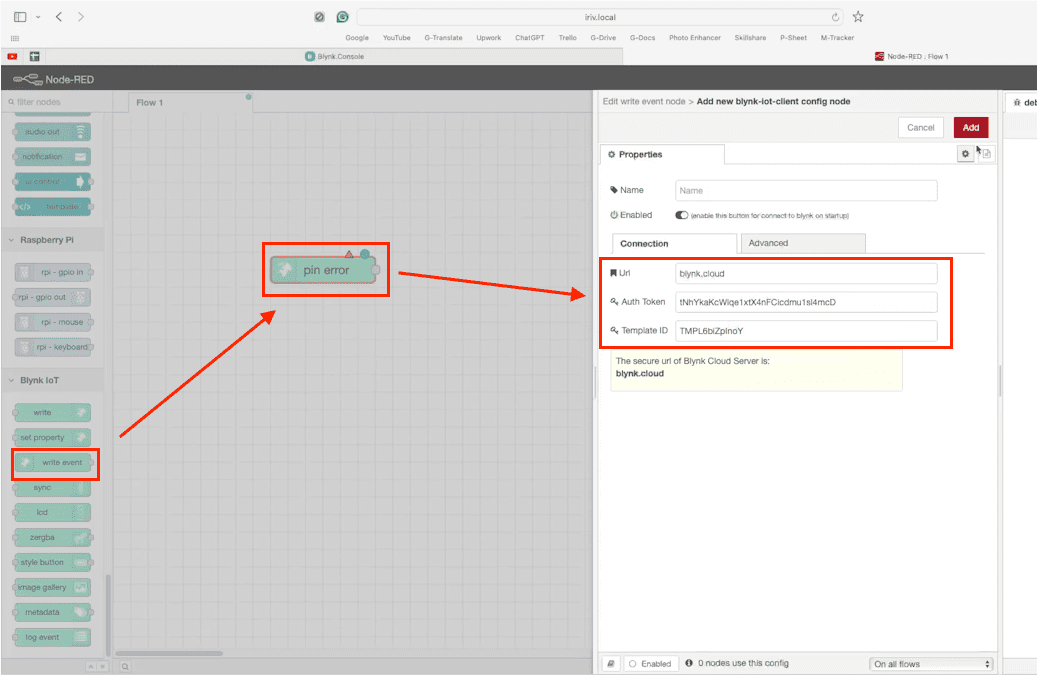
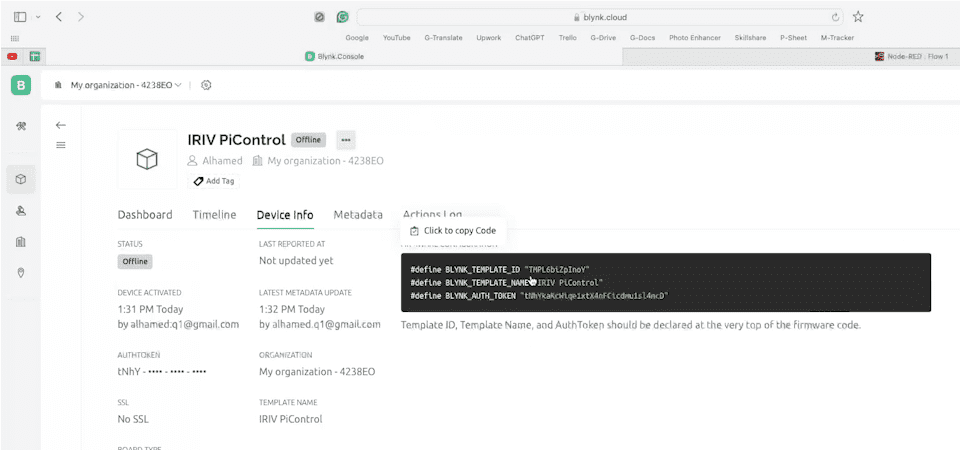
You can get these configurations from Blynk, under Device Info page.
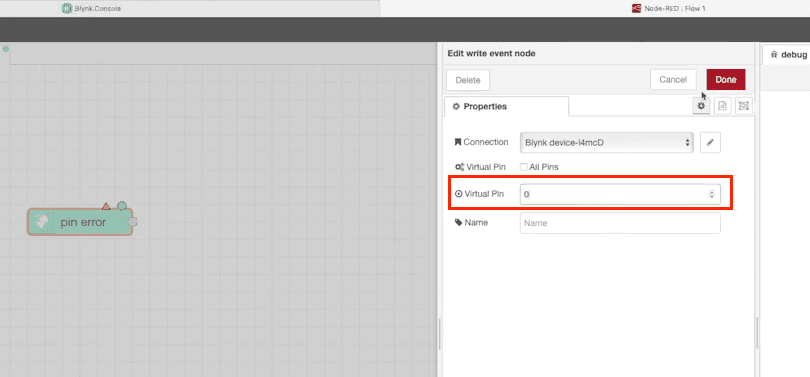
Then assign the virtual pin to 0.
Now, we will use the GPIO-out node, and select pin 20, to control LED0 on IRIV. You can refer to the datasheet for more information.
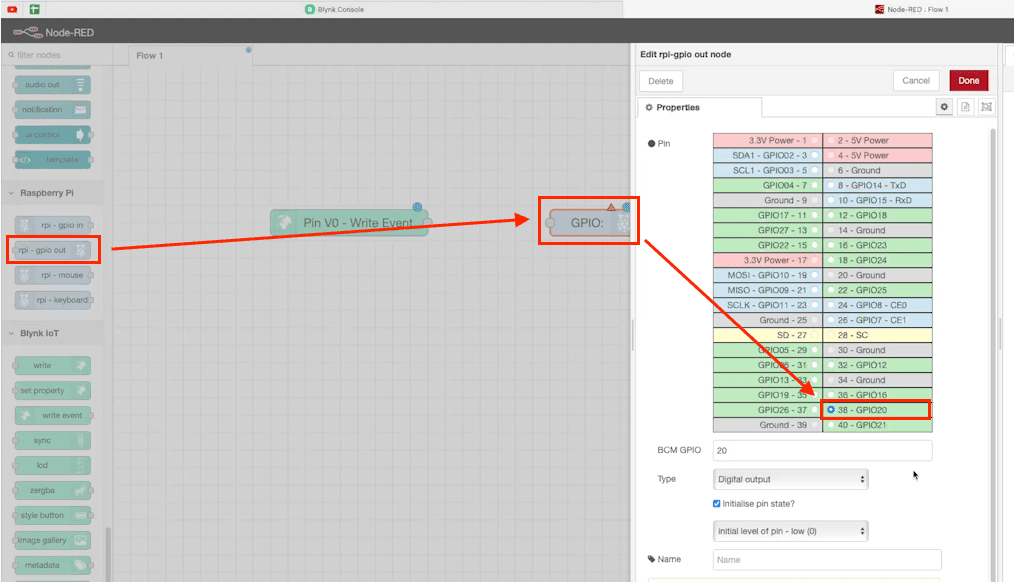
Once that is done, connect these two nodes together.
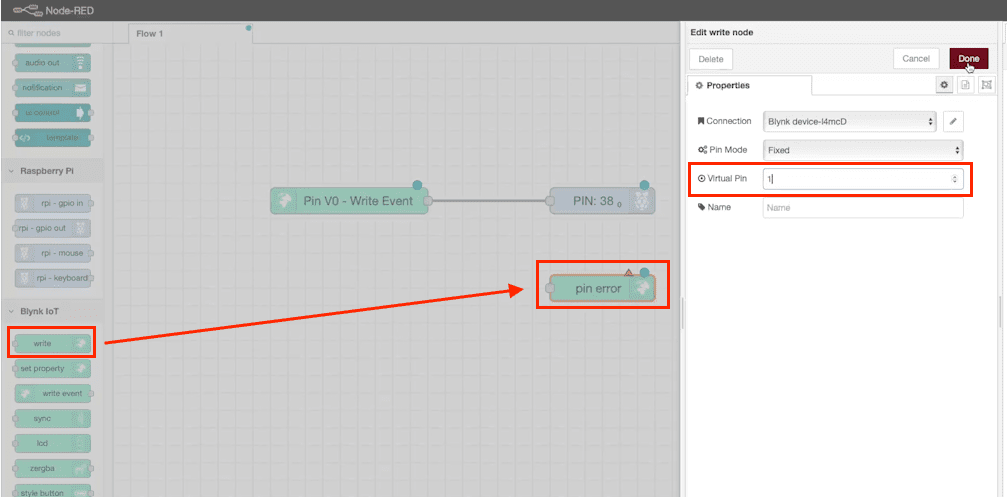
Now, we will use the Blynk “Write” node, so we can store the data in it, and send it to Blynk cloud.
Open its properties, and assign the virtual pin to 1.
Now, drag an inject node, so we can send a single value to be seen in the Gauge chart. Open its properties, and type in any number.
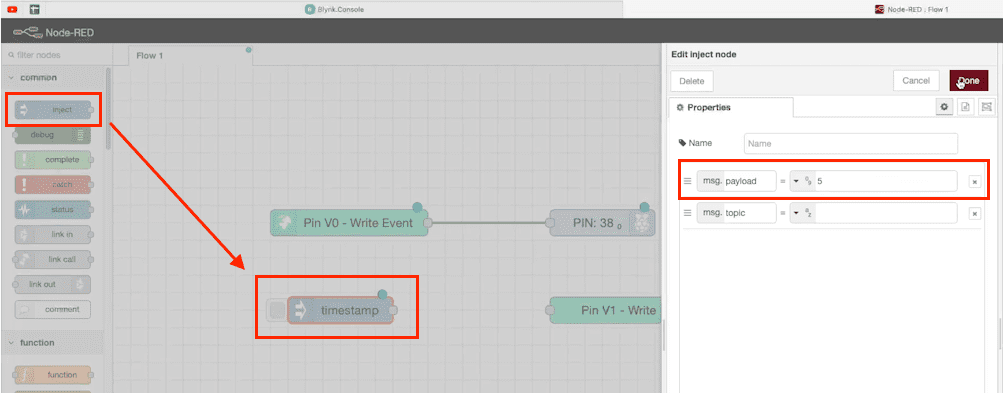
Connect these nodes together, and hit Deploy.
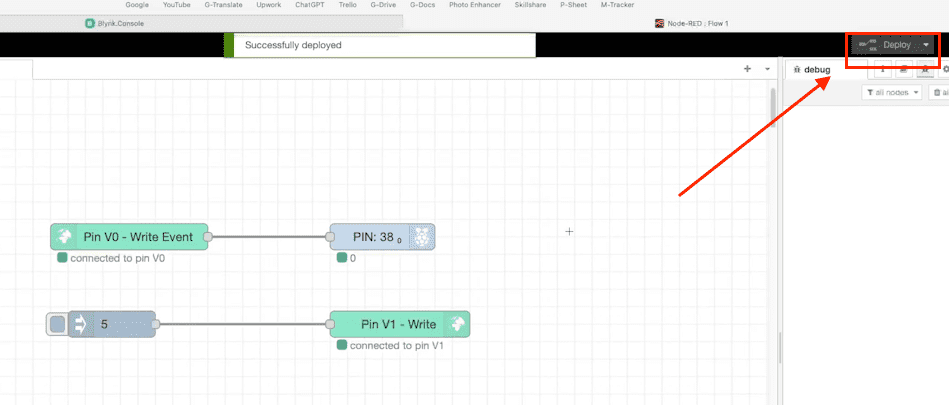
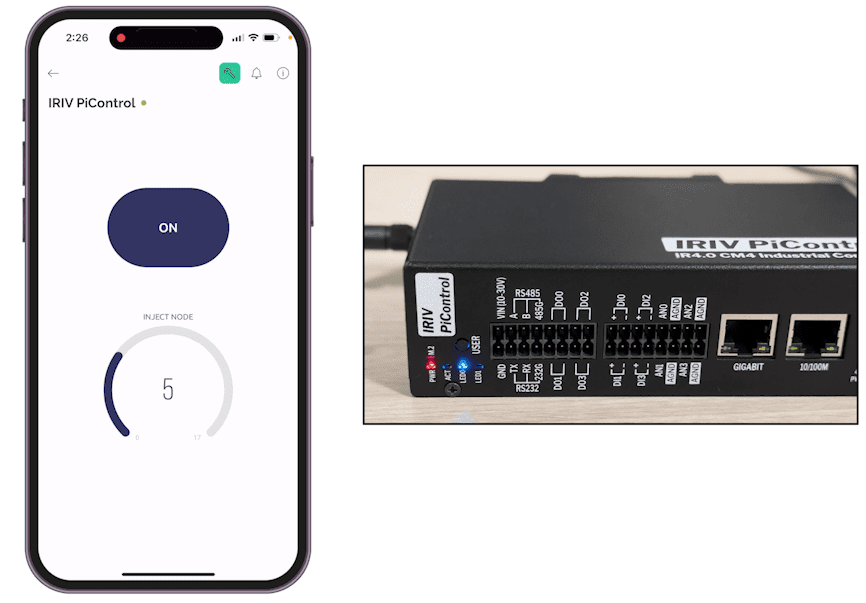
Now, once we toggle the switch on Blynk dashboard, you will notice the LED on IRIV is turned on/off.
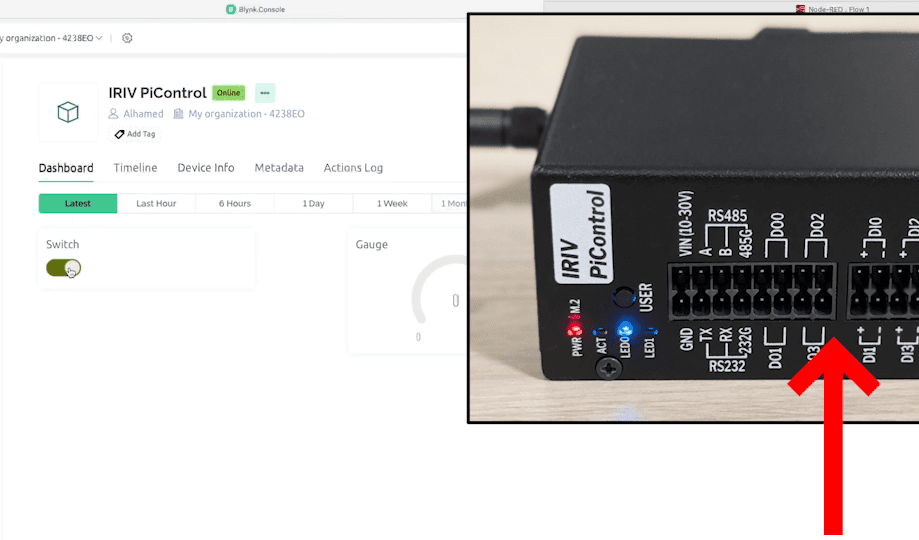
And once, we hit the inject node, the number 5 will be sent to the gauge chart.
So this is basically the main idea of controlling and monitor data on Blynk using Node-RED.
You can also use Blynk app in your phone to make the same dashboard to control and monitor the data.
Make sure to log-in into the same account, and customize the dashboard, similar like what we did in the webpage.
Monitor Sensor Data on Blynk
In this example, I’m using these nodes to store the data that are coming from the RS485-Industrial-Temperature-and Humidity-sensor and power meter.
To learn more about how these nodes work together, please read this tutorial.
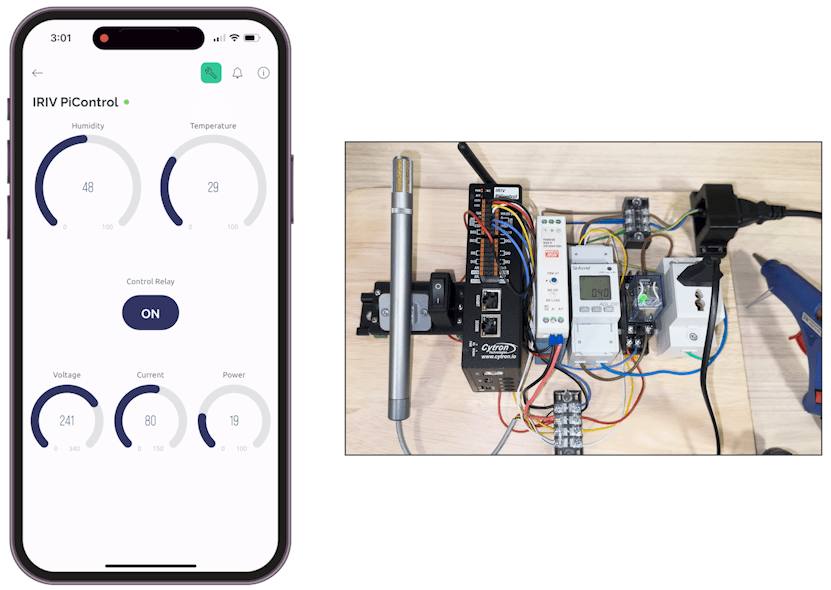
The Humidity function is assigned to V1, and the temperature function is assigned to V2, Voltage function is assigned to V3, Current to V4, and Power to V5.
And Lastly, I’ve used Blynk “Write Event” node, to control the relay that is connected to GPO23.
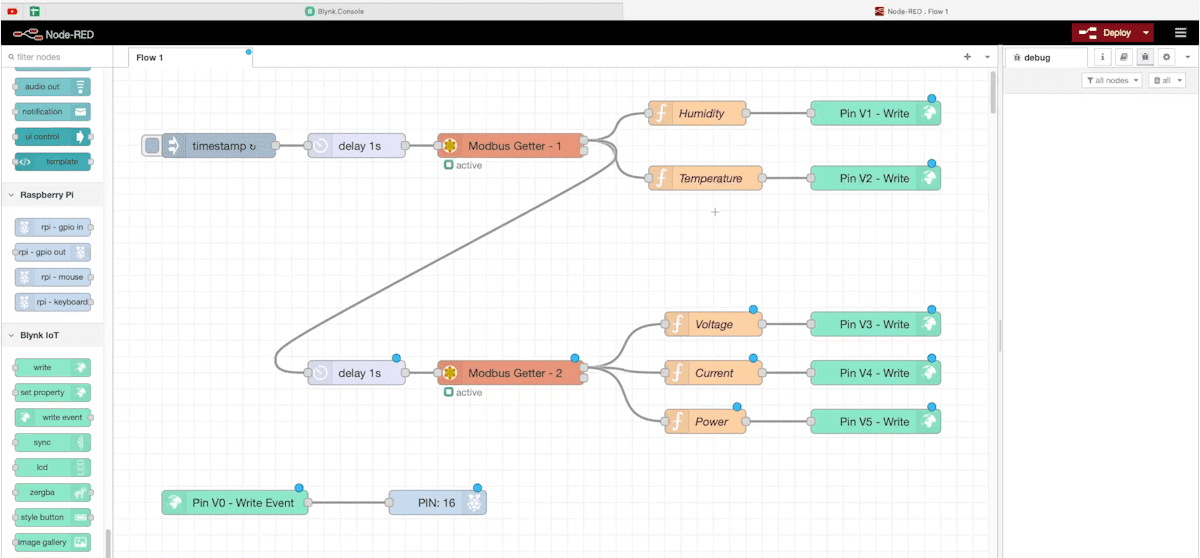
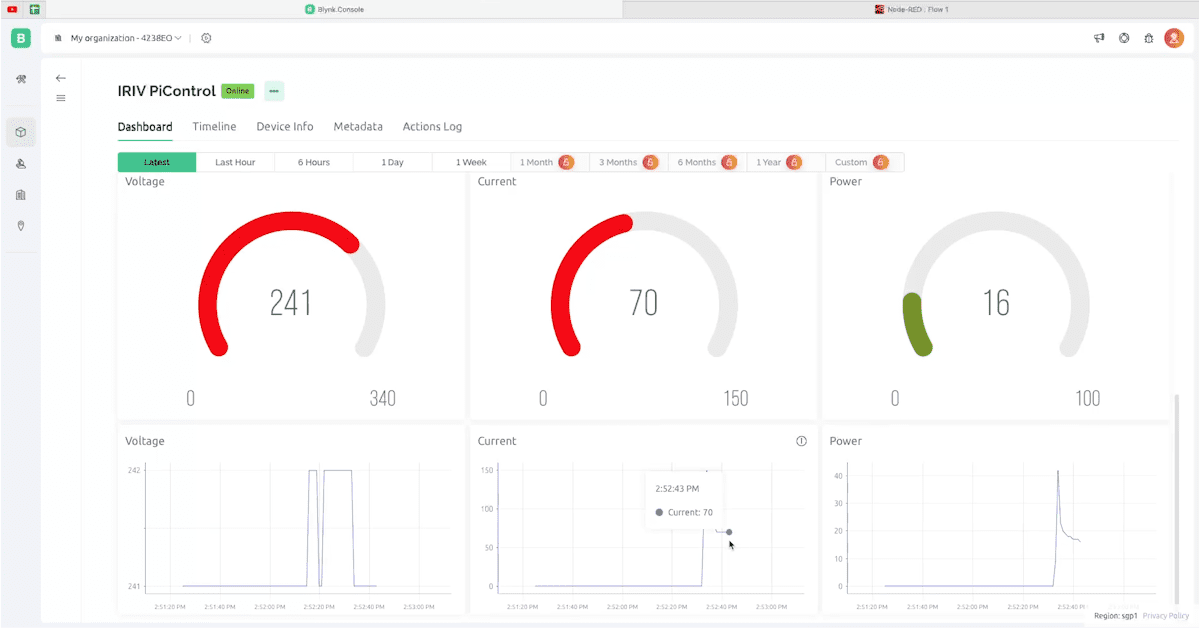
In Blynk dashboard, I’ve added a switch, gauge and line charts, and adjusted their settings and virtual pins. As you can see now, all the data that are coming from the sensors can be displayed in Blynk dashboard.
And this it how it looks like in my phone after I have created the dashboard in Blynk App.
That’s all for this tutorial, thanks for reading, and stay tuned for more.
Hardware Components

IRIV PiControl - IR4.0 CM4 Industrial Controller
S$420.00++ S$420.00
x 1 unit(s)